1970s energy crisis
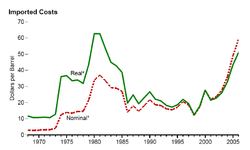 Real and Nominal price of oil, 1968–2006.[1] | |
| Date | 1973–1980 |
|---|---|
| Also known as | 1970s oil crisis |
The 1970s energy crisis was a period when the major industrial countries of the world, particularly the United States, Canada, Western Europe, Japan, Australia, and New Zealand, faced substantial petroleum shortages, real and perceived, as well as elevated prices. The two worst crises of this period were the 1973 oil crisis and the 1979 energy crisis, when the Yom Kippur War and the Iranian Revolution triggered interruptions in Middle Eastern oil exports.[2]
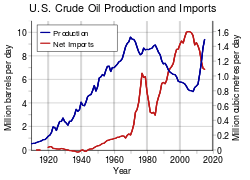
The crisis began to unfold as petroleum production in the United States and some other parts of the world peaked in the late 1960s and early 1970s.[3] World oil production per capita began a long-term decline after 1979.[4]
The major industrial centers of the world were forced to contend with escalating issues related to petroleum supply. Western countries relied on the resources of potentially unfriendly countries in the Middle East and other parts of the world.
The crisis led to stagnant economic growth in many countries as oil prices surged. Although there were genuine concerns with supply, part of the run-up in prices resulted from the perception of a crisis. The combination of stagnant growth and price inflation during this era led to the coinage of the term stagflation.[5]
By the 1980s, both the recessions of the 1970s and adjustments in local economies to become more efficient in petroleum usage, controlled demand sufficiently for petroleum prices worldwide to return to more sustainable levels.
The period was not uniformly negative for all economies. Petroleum-rich countries in the Middle East benefited from increased prices and the slowing production in other areas of the world. Some other countries, such as Norway, Mexico, and Venezuela, benefited as well. In the United States, Texas and Alaska, as well as some other oil-producing areas, experienced major economic booms due to soaring oil prices even as most of the rest of the nation struggled with the stagnant economy. Many of these economic gains, however, came to a halt as prices stabilized and dropped in the 1980s.
Key periods
Production peaks around 1970
During the 1960s petroleum production in some of the world's top producers began to peak. Germany reached its production peak in 1966, Venezuela and the United States in 1970, and Iran in 1974.[6] Canada's conventional oil production peaked around this same time (though non-conventional production later helped revive Canadian production to some degree).[7] The worldwide production per capita peaked soon afterward.[4]
Though production in other parts of the world was increasing, the peaks in these regions began to put substantial upward pressure on world oil prices. Equally as important, control of the oil supply became an increasingly important problem as countries like Germany and the U.S. became increasingly dependent on foreign suppliers for this key resource.
1973 oil crisis
The 1973 oil crisis is a direct consequence of the US production peak in late 1970 and the beginning of 1971 (and shortages, especially for heating oil, started from there). The "embargo" as described below is the "practical name" given to the crisis, allowing the US to "lie to itself" or hide its production peak towards its citizens. For the main Arab producers, the "embargo" allowed to show to "the Arab street" that they were doing something for the Palestinians. In real market terms (number of barrels) the embargo was almost a non-event, and only from a few countries, towards a few countries.[8]
It should also be noted that the "Embargo" was never effective from Saudi Arabia towards the US, as reported by James Akins in interview at 24:10 in the documentary "la face cachée du pétrole part 2".[9] James Akins, who audited US capacity for Nixon after US peak, was US ambassador in Saudi Arabia at that time.
In October 1973, the members of Organization of Arab Petroleum Exporting Countries or the OAPEC (consisting of the Arab members of OPEC) proclaimed an oil embargo "in response to the U.S. decision to re-supply the Israeli military" during the Yom Kippur war; it lasted until March 1974.[10] OAPEC declared it would limit or stop oil shipments to the United States and other countries if they supported Israel in the conflict. With the US actions seen as initiating the oil embargo, the long-term possibility of embargo-related high oil prices, disrupted supply and recession, created a strong rift within NATO; both European countries and Japan sought to disassociate themselves from the US Middle East policy. Arab oil producers had also linked the end of the embargo with successful US efforts to create peace in the Middle East, which complicated the situation. To address these developments, the Nixon Administration began parallel negotiations with both Arab oil producers to end the embargo, and with Egypt, Syria, and Israel to arrange an Israeli pull back from the Sinai and the Golan Heights after the fighting stopped. By January 18, 1974, Secretary of State Henry Kissinger had negotiated an Israeli troop withdrawal from parts of the Sinai. The promise of a negotiated settlement between Israel and Syria was sufficient to convince Arab oil producers to lift the embargo in March 1974. By May, Israel agreed to withdraw from the Golan Heights.[10]
Independently, the OPEC members agreed to use their leverage over the world price-setting mechanism for oil to stabilize their real incomes by raising world oil prices. This action followed several years of steep income declines after the recent failure of negotiations with the major Western oil companies earlier in the month.
For the most part, industrialized economies relied on crude oil, and OPEC was their major supplier. Because of the dramatic inflation experienced during this period, a popular economic theory has been that these price increases were to blame, as being suppressive of economic activity. However, the causality stated by this theory is often questioned.[11] The targeted countries responded with a wide variety of new, and mostly permanent, initiatives to contain their further dependency. The 1973 "oil price shock", along with the 1973–1974 stock market crash, have been regarded as the first event since the Great Depression to have a persistent economic effect.[12]
1979 energy crisis
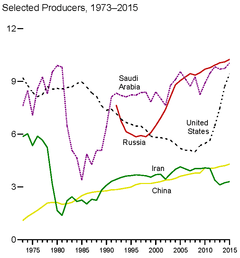
A crisis emerged in the United States in 1979 during the wake of the Iranian Revolution. Amid massive protests, the Shah of Iran, Mohammad Reza Pahlavi, fled his country in early 1979, allowing the Ayatollah Khomeini to gain control. The protests shattered the Iranian oil sector. While the new regime resumed oil exports, it was inconsistent and at a lower volume, forcing prices to go up. Saudi Arabia and other OPEC nations, under the presidency of Dr. Mana Alotaiba increased production to offset the decline, and the overall loss in production was about 4 percent.[14] However, a widespread panic resulted, driving the price far higher than would be expected under normal circumstances.
In 1980, following the Iraqi invasion of Iran, oil production in Iran nearly stopped, and Iraq's oil production was severely cut as well.
After 1980, oil prices began a decline as other countries began to fill the production shortfalls from Iran and Iraq.
1980s oil glut
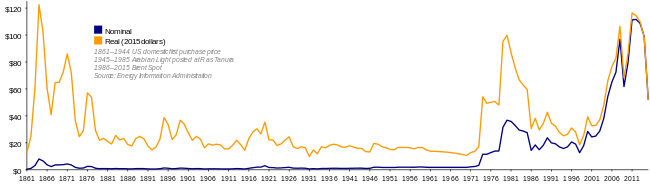
The 1973 and 1979 energy crisis had caused petroleum prices to peak in 1980 at over US$35 per barrel (US$101 in today's dollars). Following these events slowing industrial economies and stabilization of supply and demand caused prices to begin falling in the 1980s.[15] The glut began in the early 1980s as a result of slowed economic activity in industrial countries (due to the 1973 and 1979 energy crises) and the energy conservation spurred by high fuel prices.[16] The inflation adjusted real 2004 dollar value of oil fell from an average of $78.2 per barrel in 1981 to an average of $26.8 in 1986.[17]
In June 1981, The New York Times stated an "Oil glut! ... is here"[18] and Time Magazine stated: "the world temporarily floats in a glut of oil,"[19] though the next week a New York Times article warned that the word "glut" was misleading, and that in reality, while temporary surpluses had brought down prices somewhat, prices were still well above pre-energy crisis levels.[20] This sentiment was echoed in November 1981, when the CEO of Exxon Corp also characterized the glut as a temporary surplus, and that the word "glut" was an example of "our American penchant for exaggerated language." He wrote that the main cause of the glut was declining consumption. In the United States, Europe and Japan, oil consumption had fallen 13% from 1979 to 1981, due to "in part, in reaction to the very large increases in oil prices by the Organization of Petroleum Exporting Countries and other oil exporters," continuing a trend begun during the 1973 price increases.[21]
After 1980, reduced demand and overproduction produced a glut on the world market, causing a six-year-long decline in oil prices culminating with a 46 percent price drop in 1986.
Effects
Recession
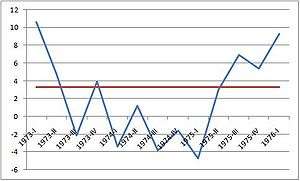
Percent Change From Preceding Period in Real Gross Domestic Product (annualized; seasonally adjusted); Average GDP growth 1947–2009
Source: Bureau of Economic Analysis
The decade of the 1970s was a period of limited economic growth due in part to the energy crises of that decade. Though the mid decade was the worst period for the United States the economy was generally weak until the 1980s. The period marked the end of the general post-World War II economic boom. It differed from many previous recessions as being a stagflation, where high unemployment coincided with high inflation.
Other causes that contributed to the recession included the Vietnam War, which turned out costly for the United States of America and the fall of the Bretton Woods system. The emergence of newly industrialized countries rose competition in the metal industry, triggering a steel crisis, where industrial core areas in North America and Europe were forced to re-structure. The 1973-1974 stock market crash made the recession evident.
According to the National Bureau of Economic Research, the recession in the United States lasted from November 1973 to March 1975.[23] Although the economy was expanding from 1975 to the first recession of the early 1980s, which began in January 1980, inflation remained extremely high for the rest of the decade.
During this recession, the Gross Domestic Product of the United States fell 3.2 percent. Though the recession ended in March 1975, the unemployment rate did not peak for several months. In May 1975, the rate reached its height for the cycle of 9 percent.[24] (Only two cycles have higher peaks than this, the current cycle, where the unemployment rate is currently 9.7% in the United States and the Early 1980s recession where unemployment peaked at 10.8% in November and December 1982.)
The recession also lasted from 1973–75 in the United Kingdom. The GDP declined by 3.9%[25][26] or 3.37%[27] depending on the source. It took 14 quarters for the UK's GDP to recover to that at the start of recession.[25]
Strategic petroleum reserves
As a result of the 1973 crisis many nations created strategic petroleum reserves (SPRs), crude oil inventories (or stockpiles) held by the governments of particular countries or private industry, for the purpose of providing economic and national security during an energy crisis. According to the United States Energy Information Administration, approximately 4.1 billion barrels (650,000,000 m3) of oil are held in strategic reserves, of which 1.4 billion is government-controlled. The remainder is held by private industry. At the moment the US Strategic Petroleum Reserve is one of the largest strategic reserves, with much of the remainder held by the other 26 members of the International Energy Agency.[28] Recently, other non-IEA countries have begun creating their own strategic petroleum reserves, with China being the largest of these new reserves. Since current consumption levels are neighboring 0.1 billion barrels (16,000,000 m3)/day, in the case of a dramatic worldwide drop in oil field output as suggested by some peak oil analysts , the strategic petroleum reserves are unlikely to last for more than a few months.
Middle East
Since Israel's declaration of independence in 1948 this state has found itself in nearly continual conflict with the Arab world and some other predominantly Muslim countries. The animosity between the Arabs and the Israelis became a global issue during the 1970s. The Yom Kippur War of 1973, with the supplying of Israel by its Western allies while some Arab states received Soviet supplies, made this one of the most internationally threatening confrontations of the period.
The large oil discoveries in the Middle East and southwestern Asia, and the peaking of production in some of the more industrialized areas of the world gave some Muslim countries unique leverage in the world, beginning in the 1960s. The 1973 and 1979 crises, in particular, were demonstrations of the new power that these countries had found. The United States and other countries were forced to become more involved in the conflicts between these states and Israel leading to peace initiatives such as the Camp David Accords.
OPEC
One of the first challenges OPEC faced in the 1970s was the United States' unilaterally pulling out of the Bretton Woods Accord and taking the U.S. off the established Gold Exchange Standard in 1971. With that standard, only the value of the U.S. dollar was pegged to the price of gold and all other currencies were pegged to the U.S. dollar. The change resulted in instability in world currencies and depreciation of the value of the U.S. dollar, as well as other currencies, and decreasing real revenues for OPEC whose producers still priced oil in dollars.
OPEC was slow to adjust to the situation but finally made the decision to price oil against gold.[29] Frustrated negotiations between OPEC and the major oil companies to revise the oil price agreement as well as the ongoing Middle East conflicts continued to stall OPEC's efforts at stabilization through this era.
"Oil Patch"
The major oil-producing regions of the U.S.—Texas, Oklahoma, Louisiana, Colorado, Wyoming, and Alaska—benefited greatly from the price inflation of the 1970s as did the U.S. oil industry in general. Oil prices generally increased throughout the decade; between 1978 and 1980 the price of West Texas Intermediate crude oil increased 250 percent.[30] Though all states felt the effects of the stock market crash and related national economic problems, the economic benefits of increased oil revenue in the Oil Patch states generally offset much of this.
See also
- Energy crisis
- 1973 oil crisis
- 1973–75 recession
- 1979 energy crisis
- 1979 world oil market chronology
- 1980s oil glut
- 1990 oil price shock
- Hubbert peak theory
| Timeline | .svg.png) | |
|---|---|---|
| Topics | ||
| ||
References
- ↑ "Annual Energy Review 2006, Figure 5.21" (PDF). U.S. Energy Information Administration, Department of Energy. June 2007. Retrieved 30 May 2016.
- ↑ "Oil Squeeze". Time. 1979-02-05. Archived from the original on 7 September 2013. Retrieved 7 September 2013.
- ↑ Hubbert, Marion King (June 1956). Nuclear Energy and the Fossil Fuels 'Drilling and Production Practice' (PDF). Spring Meeting of the Southern District. Division of Production. American Petroleum Institute. San Antonio, Texas: Shell Development Company. pp. 22–27. Archived (PDF) from the original on 27 May 2008. Retrieved 2008-04-18.
- 1 2 Duncan, Richard C (November 2001). "The Peak of World Oil Production and the Road to the Olduvai Gorge". Population and Environment. Springer Netherlands. 22 (5): 503–522. doi:10.1023/A:1010793021451. ISSN 1573-7810. Retrieved 2009-07-11.
- ↑ Mankiw, N. Gregory; Scarth William M. (2003). Macroeconomics: Canadian Edition Updated. New York: Worth Publishers. p. 270. ISBN 978-0-7167-5928-7. Retrieved 13 November 2009.
- ↑ "Petroleum Overview, 1949-2008". U.S. Department of Energy. Archived from the original on 3 October 2009. Retrieved 2 October 2009.
"ABC TV's Four Corners". Austrialian Broadcasting Company. Archived from the original on 14 October 2009. Retrieved 2 October 2009. - ↑ Zittel, Werner; Schindler, Jörg (January 2003). "Future world oil supply" (PDF). L-B-Systemtechnik. p. 11. Archived from the original (PDF) on July 18, 2011. Retrieved 2 November 2009.
- ↑ Maugeri, Leonardo. The Age of Oil: The Mythology, History, and Future of the World's Most Controversial Resource. Page 113
- ↑ "The hidden face of oil".
- 1 2 Oil Embargo, 1973–1974, at US State Department
- ↑ Barsky, R.; Kilian, L. (2004), "Oil and the Macroeconomy Since the 1970s" (PDF), Journal of Economic Perspectives, 8: 115–134, retrieved 21 January 2016
- ↑ Perron, P.; University, Princeton; Program, Econometric Research (1988), The Great Crash, the Oil Price Shock and the Unit Root Hypothesis (PDF), Econometric Research Program, Princeton University Princeton, NJ, retrieved 15 November 2009
- ↑ "Monthly Energy Review, April 2016, Figure 11.1a" (PDF). U.S. Department of Energy. 26 April 2016. Retrieved 30 May 2016.
- ↑ "Oil Squeeze". Time. 1979-02-05. Archived from the original on 1 December 2009. Retrieved 1 November 2009.
- ↑ Mouawad, Jad (2008-03-08). "Oil Prices Pass Record Set in '80s, but Then Recede". New York Time. Retrieved 2010-04-20.
- ↑ "Oil Glut, Price Cuts: How Long Will They Last?". Volume: 89 Issue: 7 Page: 44. U.S. News & World Report. 1980-08-18.
- ↑ Oak Ridge National Lab data
- ↑ Robert D Hershey Jr. (1981-06-21). "How the oil glut is changing business". New York Times. Retrieved 1 November 2009.
- ↑ Christopher Byron (1981-06-22). "Problems for Oil Producers". Time Magazine. Retrieved 1 November 2009.
- ↑ Daniel Yergin (1981-06-28). "The Energy Outlook; Lulled to Sleep by the Oil Glut Mirage". Section 3; Page 2, Column 3. New York Times.
- ↑ C. C. Garvin Jr. (November 9, 1981). "The oil glut in perspective". Annual API Issue; Pg. 151. Oil & Gas Journal.
- ↑ Martha C. White (January 12, 2009). "This Recession Was Brought to You by the Letters U, V and L". The Big Money. Retrieved 2 November 2009.
- ↑ "NBER Business Cycle Expansions and Contractions". NBER. Archived from the original on 2007-07-17. Retrieved 2008-10-01.
- ↑ Labor Force Statistics from the Current Population Survey, Bureau of Labor Statistics. Retrieved on September 19, 2009
- 1 2 Bank of England February 2009 Quarterly inflation report
- ↑ Office for National Statistics, IHYQ series, Gross Domestic Product: Quarter on Quarter growth: CVM SA, Seasonally adjusted, Constant 2003 prices, Updated on 23/ 1/2009, retrieved on 17 February 2009 Archived March 30, 2006, at WebCite
- ↑ ONS GDP ABMI series
- ↑ "Fact Sheet on IEA Oil Stocks and Emergency Response Potential" (PDF). International Energy Agency. 2004-01-01. Retrieved 7 November 2009.
- ↑ Hammes, David; Wills, Douglas. (Spring 2005). "Black Gold: The End of Bretton Woods and the Oil-Price Shocks of the 1970s". The Independent Review. v. IX (n. 4): 501–511. Retrieved 3 November 2009.
- ↑ Angell, Cynthia; Williams, Norman (8 April 2005). "U.S. Home Prices: Does Bust Always Follow Boom?". Federal Deposit Insurance Corporation. Retrieved 8 November 2009.